Learning Introductory Physics with Activities

Section 20.6 Spectra

A spectrometer is a device, typically using a prism or diffraction grating, that allows you to separate a light source into the various wavelengths that make up that light. The resulting distribution is known as the spectrum of the light source, and might be represented by a spectrograph, such as the examples below.

Note 20.6.1. How to Use a Spectrometer.

If you have access to a spectrometer, the steps below will help you use it. As with other optical devices, do not use a spectrometer to view the Sun.
Look through the side of the spectrometer with no numbers at a source of light. When you have it aligned correctly, you should see a narrow vertical strip of light.
Without moving the spectrometer, look through the other side of the device (the side with numbers). You should now be able to see the wavelengths (colors) of light that make up the light source!

On a black background, four vertical lines, from left to right: violet, blue, cyan, red.
Figure 20.6.2. Visible lines in the hydrogen emission spectrum.
On a black background, many colored vertical lines, each corresponding to a spectral line.
Figure 20.6.3. Simulated emission spectrum of neutral Helium (He I) based on data from the National Institute of Standards and Technology Atomic Spectra Database (NIST ASD)
On a black background, many colored vertical lines, each corresponding to a spectral line.
Figure 20.6.4. Simulated emission spectrum of neutral Sodium (Na I) based on data from the National Institute of Standards and Technology Atomic Spectra Database (NIST ASD).
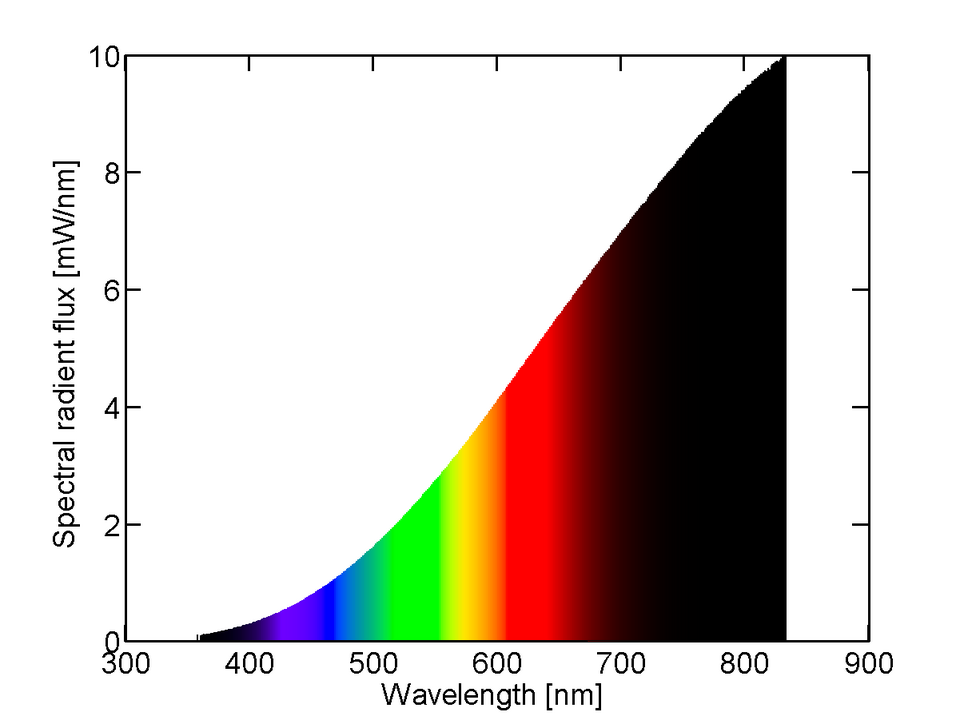
A graph showing, from left to right, the purple to red visible spectrum of an incandescent bulb.
Figure 20.6.5. Spectral power distribution of a 25 W incandescent light bulb, measured at the Department of Photonics Engineering at the Technical University of Denmark. With a calibrated Instrument systems CAS - 140 Array spectrometer. Spectral colors added as sRGB values for monochromatic light scaled with the the luminosity function.

Subsubsection Activities

Activity 20.6.1. Spectra and Spectral Lines.

What similarities stand out across the various spectra shown above? Are there any light sources that seem especially unique?

Activity 20.6.2. Spectrum of the Sun.

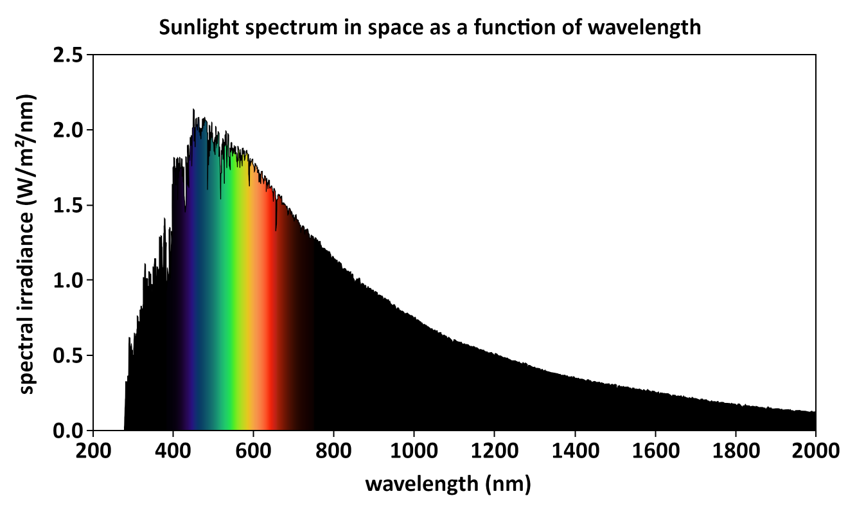
The spectrum below shows light emitted from the Sun.
A graph showing, from left to right, the purple to red spectrum of the sun.
Figure 20.6.6. Spectrum of light emitted by the Sun.
What features does this have in common with the various light sources you have already looked at?

References References

[1]
The spectrum of hydrogen image has been released into the public domain by its author, Merikanto, and is taken from the English Wikipedia project.
[2]
Kramida, A., Ralchenko, Yu., Reader, J., and NIST ASD Team (2024). NIST Atomic Spectra Database (ver. 5.12), Online. Available: [2] (2025, January 19). National Institute of Standards and Technology, Gaithersburg, MD. doi:10.18434/T4W30F
[3]
Kramida, A., Ralchenko, Yu., Reader, J., and NIST ASD Team (2024). NIST Atomic Spectra Database (ver. 5.12), Online. Available: [2] (2025, January 20). National Institute of Standards and Technology, Gaithersburg, MD. doi:10.18434/T4W30F
[4]
The Incandescent Spectrum is licensed under the Creative Commons Attribution-Share Alike 4.0 International license: https://commons.wikimedia.org/wiki/File:Spectral_power_distribution_of_a_25_W_incandescent_light_bulb.png.
[5]
Public Domain Image, image source: Christopher S. Baird, data source: American Society for Testing and Materials Terrestrial Reference.