Section 22.2 Charge Diagrams
Subsubsection Key Ideas
Representation 22.2.2. Charge Diagram.
A charge diagram shows a simple picture of an object with small \(+\) and \(-\) labels indicating where charge is present, what type of charge is present, and where the charge density is greatest and smallest.
Subsubsection Activities
Activity 22.2.1. Charge Densities.
Make a charge diagram for each of the following charge densities. What is the purpose of the various constants in these expressions?
-
\(\lambda(x) = +\lambda_1 \frac{x}{L}\) between \(x=-L\) and \(x=+L\)
-
\(\lambda(y) = \frac{+q_2}{y}\) between \(y=0\) and \(y=\infty\)
-
\(\sigma(s,\theta) = +\sigma_3 \frac{s^2}{R^2}\) between \(s=0\) and \(s=R\text{,}\) where \(s\) is the radial distance from the origin.
Activity 22.2.2. Charge Diagram.
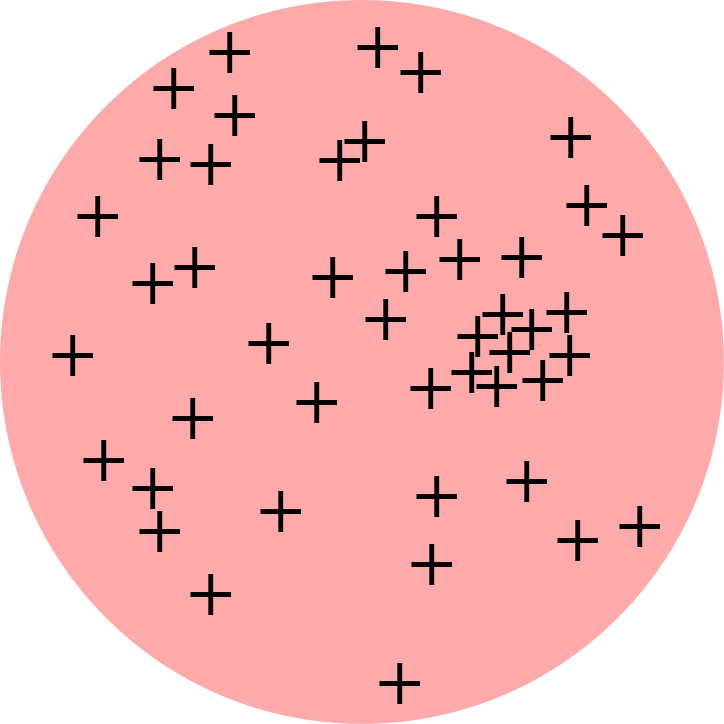
Shown above is a charge diagram for a disc. Indicate the location with the greatest charge density.
