Describe the motion of the ball between the green markers in words. Use complete sentences. Did you make any assumptions or idealizations about the ball’s motion?
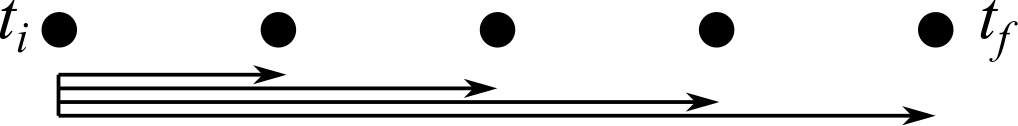
A strobe diagram is a physical representation in which an object is represented at different instants in time that are separated by equal time intervals. For each instant, you can draw a vector (starting at the origin) to represent the object’s position.
You will encounter many different representations in physics. In fact, you have already seen several other representations, including numerical values, symbolic equations, and even verbal descriptions! Diagrams, graphs, and other visual representations are especially common and useful, as they give you alternative ways to display information in a way that is often compact, simple, and useful.
A motion diagram is a physical representation in which an object is represented at different instants in time that are separated by equal time intervals. For each instant, you should draw a vector representing the object’s velocity. Often, it is also useful to draw vectors representing the object’s acceleration.
At each point on your diagram, add a vector representing the instantaneous velocity at that instant. You should be able to explain how you used the position vectors you have already drawn to determine both the magnitude and the direction of your new velocity vectors.
It is also common to add acceleration vectors to a motion diagram by repeating the process above. It can be helpful to use clear labels along with a different color and scale for the acceleration vectors to distinguish them from the velocity vectors.
At each point on your diagram, add a vector representing the instantaneous acceleration at that instant. You should be able to explain how you used the velocity vectors you have already drawn to determine both the magnitude and the direction of your new acceleration vectors. Make sure your acceleration vectors are consistent with any assumptions you made about the acceleration at the beginning of the activity.