Section 19.3 Interference Patterns
Subsubsection Key Ideas
Applying the general rules for Maximum Constructive Interference and Complete Destructive Interference from the Interference and Path Length Difference Sections allows you to determine the spacing of the interference pattern by looking at the path length difference of the rays exiting the slits. The figure below gives a magnified look at the paths traveled by the two rays.
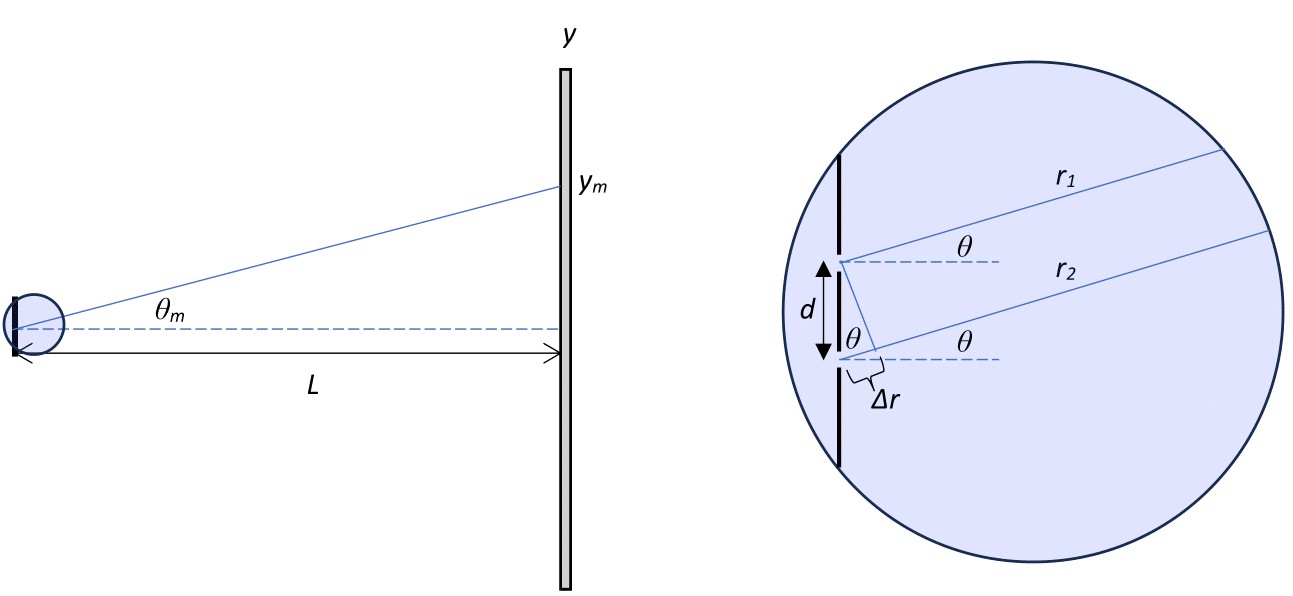
If the screen is far away from the sources, the two rays in the figure above may be treated as parallel, allowing you to calculate the path-length difference using trigonometry.
Assumption 19.3.3. Two-Source Path Length Difference.
For a screen that is far away from two sources of light, the path length difference can be approximated as
\begin{equation*}
\Delta D = d \sin \theta
\end{equation*}
where \(d\) is the distance between slits and \(\theta\) is the angle between the center line and the path to a spot on the screen.
Subsubsection Activities
Activity 19.3.1. Constructive Interference.
Combine the geometric path-length difference found above and the general rule for Maximum Constructive Interference to find an equation relating \(d\text{,}\) \(\lambda\text{,}\) and \(\theta\) for the bright spots on the screen.
Activity 19.3.2. Destructive Interference.
Combine the geometric path-length difference found above and the general rule for Complete Destructive Interference to find an equation relating \(d\text{,}\) \(\lambda\text{,}\) and \(\theta\) for the dark spots on the screen.
Activity 19.3.3. The Small Angle Approximation.
In the video, you learned about using the Small-angle Approximation for interference. Use the small-angle approximation to write an equation relating \(d\text{,}\) \(y\text{,}\) \(L\text{,}\) and \(\lambda\) for points of maximum constructive interference.
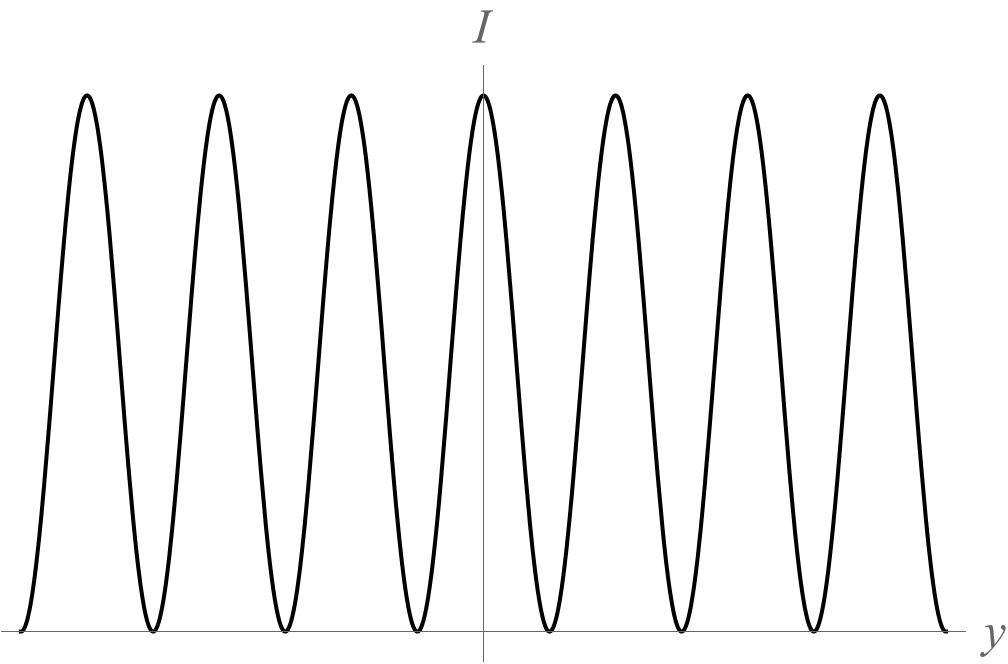
The process above will allow you to find locations where the light exhibits maximum intensity (bright spots) and zero intensity (dark spots). It is also possible to determine that the intensity at any given point on the screen under the approximations described above is
\begin{equation*}
I(y) = I_0 \cos^2{\left(\frac{\pi d}{L\lambda}y\right)}
\end{equation*}
where \(I_0\) is the intensity of one of the point sources.
Representation 19.3.4. Intensity Graph.
An intensity graph shows the intensity of light in some region, often on a screen. The example below is for light on a distant screen that has passed through two extremely narrow slits (using the small-angle approximation).
Activity 19.3.4. Measure the Wavelength.
You are conducting the double slit experiment and you have a light source with an unknown wavelength. The slits are separated by a distance of \(0.5 \mathrm{~mm}\) and your screen is \(3.4 \mathrm{~m}\text{.}\) You measure the third bright fringe to be at a position of \(4.7 \mathrm{~mm}\) to the right of the center line on the screen. What is the wavelength of light?
