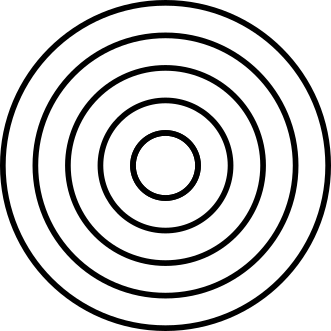
Not all waves are one-dimensional—in fact, most waves are two- or even three-dimensional. The diagram below shows a periodic circular wave, where each circle represents a wave crest.
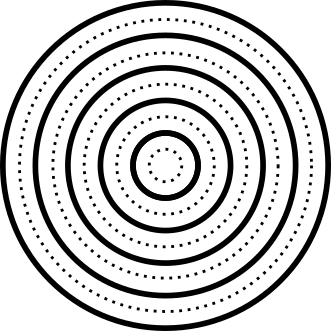
One way to represent the troughs would be with dotted or dashed lines, as in the figure below. If you wanted to try to represent more than just the crests and troughs, you might have to use color or some alternative method.
How does the shape of the circular wave change as time moves forward? What happens to each crest? Are there any especially interesting moments in time? Explain your reasoning.
Each wave moves outward, so each circle gets larger as time moves forward. If you watch one point on the water that is initially at a crest, it will decrease to a trough and then increase back to a crest again.
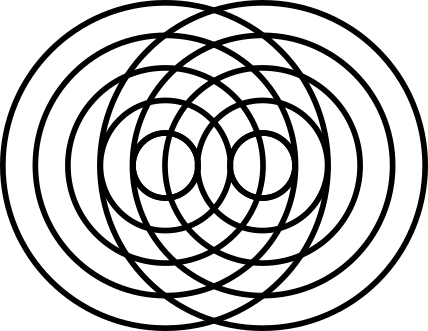
Suppose that two sources of circular waves are separated by a distance \(d\text{.}\) You are allowed to stand anywhere you want. Wherever you are standing, you measure the distance from you to each of the two wave sources. Then, you subtract these two distances to find the path length difference (\(\Delta D\)). What are the (1) largest and (2) smallest values of the path length difference for this situation? Where are you standing in each case?
The largest path length difference is equal to \(d\text{,}\) and you are standing along the line that passes through both sources (not between the sources). The smallest path length difference is equal to 0, and you are standing on the line that passes perpendicularly through the midpoint between the sources.