A first step in building a wave model is to consider different representations (words, graphs, equations, etc.) to help describe the behaviors of waves. While the figure below shows actual waves in time and space, simplified graphical representations will be more useful.
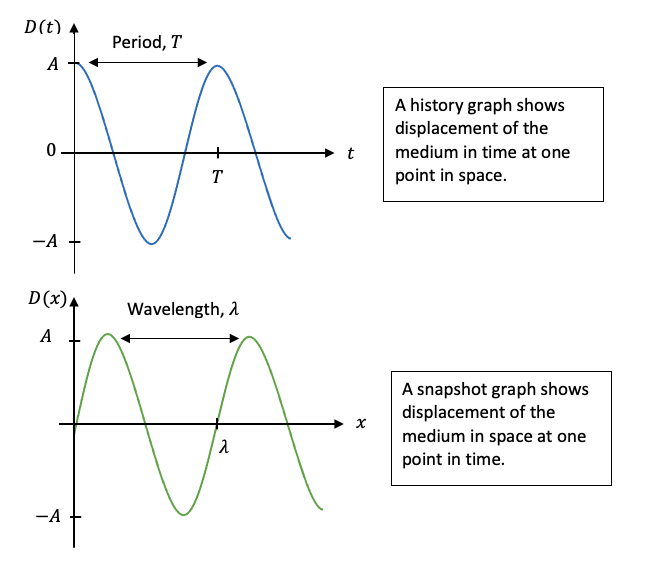
When modeling the motion of point particles, you primarily used a Motion Graph to show, for example, the position of an object across many different instants in time. This sort of graph can still be used to show the motion of one position in a medium over time. This is known as a history graph.
When you have a history graph, a quantity of note is the period\(T\text{:}\) the time it takes to complete one full oscillation. As in simple harmonic motion, the period is related to the frequency by
\begin{equation*}
T = \frac{1}{f} = \frac{2\pi}{\omega}
\end{equation*}
Another quantity of note is the amplitude: the maximum displacement away from equilibrium of a particle in the medium.
Recall from simple harmonic motion the relationship between angular frequency, frequency, and period,
\begin{equation*}
\omega = 2 \pi f = \frac{2 \pi}{T}
\end{equation*}
Time is the physical quantity that connects angular frequency, frequency and period. There is an analogous spatial relationship between wavelength and a quantity called the wavenumber\(k \text{:}\)
\begin{equation*}
k = \frac{2 \pi}{\lambda}
\end{equation*}
The wavenumber represents the spatial frequency of a wave over a unit distance.
A friend tells you about a wave with wavenumber \(k = \frac{4\pi}{7} \mathrm{~\frac{rad}{m}}\text{.}\) What is the wavelength of this wave? What would the wavenumber be for a different wave with double the wavelength?