You now have two major quantities for describing motion: position and velocity. You want to make sure both kinds of quantities can be encoded in a motion diagram.
Representation2.7.1.Motion Diagram.
A motion diagram is a physical representation in which an object is represented at different positions that are separated by equal time intervals. For each instant, you can draw and label a vector indicating the velocity of our object of interest.
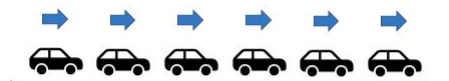
The simplest possible motion is motion along a straight-line path with a constant, unvarying speed. Let’s imagine a car that is driving to the right at a constant speed. Suppose you take images at a regular time interval, once every second:
Figure2.7.2.A stroboscopic diagram of a car moving at constant speed.
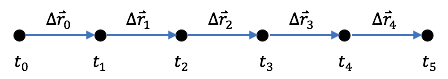
You can apply the particle model and represent the car as a point object, creating a motion diagram showing the position of the car at each instant of time and the corresponding displacement vectors.
Figure2.7.3.A motion diagram of a car moving at constant speed.
Notice that the displacement vectors are equal in length when the car moves at constant speed.
ExercisesPractice Activities
1.Extending Your Previous Work.
Recall the motion diagram you made for the ball rolling across the floor: Figure 2.5.1.
At each point on your diagram, add a vector representing the instantaneous velocity at that instant. You should be able to explain how you used the position vectors you have already drawn to determine both the magnitude and the direction of your new velocity vectors.
Use the strobe diagram below for the remaining exercises. The diagram shows a ball moving from left to right. A total of \(1 \mathrm{~s}\) has passed between each successive dot. The distance between the leftmost and rightmost points is \(12 \mathrm{~m}\text{.}\)
Figure2.7.4.A strobe diagram.
2.Practice Creating a Motion Diagram.
Use the strobe diagram to make a motion diagram with both position and velocity vectors.
3.Explanation.
Describe how the velocity of the ball is changing. Explain how you can tell from the strobe diagram.